
You may have heard colleagues or industry experts talking about Microsoft Clarity. But what is it and how does it work?
Microsoft Clarity is a user behavior and website debugging analytics tool like no other.
What Clarity does is provide insights into how users interact with the site, which makes it very different from other analytics tools, including Google Analytics.
Learn about its various features, limitations, why it’s not a competitor to Google Analytics, and how you can get the most out of Microsoft Clarity here.
User experience analytics
Other analytics tools focus on things like reporting on traffic, keywords, page popularity, and so on.
Microsoft Clarity focuses on the user experience to help publishers gain insights into how users interact with their sites.
User behavior data helps publishers identify areas to improve, find web page errors, and gain insights about conversions, among many other useful insights.
Microsoft Clarity also provides machine learning and AI components deep in the background that automatically generate insights based on patterns generated by website user behaviors. Provides these insights as suggestions for further investigation and tracking.
With Clarity, the publisher can see user interaction patterns in different parts of individual pages and can trigger user sessions to see how users interact with web pages.
More than 25 filters make it easy to focus on a user’s pain points to correct website problems or discover what works in order to replicate that experience on other pages.
All of these insights are delivered by Microsoft Clarity in near real time.
Microsoft Clarity vs. Google Analytics
You may be wondering if you need Microsoft Clarity if you already have Google Analytics. Some believe that since they are both analytics services, there may be an overlap between the two.
However, there really is no comparison between Google Analytics and Microsoft Clarity because they do very different things.
Google Analytics provides insight into traffic patterns.
Microsoft Clarity provides actionable insights into how users interact with web pages.
Microsoft Clarity is not a competitor to Google Analytics. Instead, it actually complements Google Analytics to an extent You can link Google Analytics with clarity and gain more user behavior insights with imported data.
Privacy compliance
Although Microsoft Clarity tracks user behavior on the website, Clarity is fully compliant with European General Data Protection Regulation (GDPR) and California CCPA privacy requirements.
Microsoft Clarity’s impact on page speed
JavaScript from Microsoft Clarity loads asynchronously and, according to Microsoft, does not affect website performance.
“Your visitors will not experience any difference in site speed or performance. Clarity JavaScript is asynchronous so it does not slow down page load time.”
Does Microsoft Clarity have traffic restrictions?
There are no limits to the amount of traffic that can be measured by Clarity.
Unlike other heat mapping and analytics tools that impose traffic restrictions for the free versions of their tools, Microsoft does not impose any traffic restrictions.
According to Microsoft:
There are absolutely no limits to the number of websites per account. Clarity can be scaled to support even the largest websites.
Clarity processes more than 1 petabyte of data from over 100 million users per month. Also, there are no traffic restrictions on these sites.
Microsoft Clarity features
The main features of Microsoft Clarity are:
- definition heat maps.
- Session recordings.
- Clarity Visions.
definition heat maps
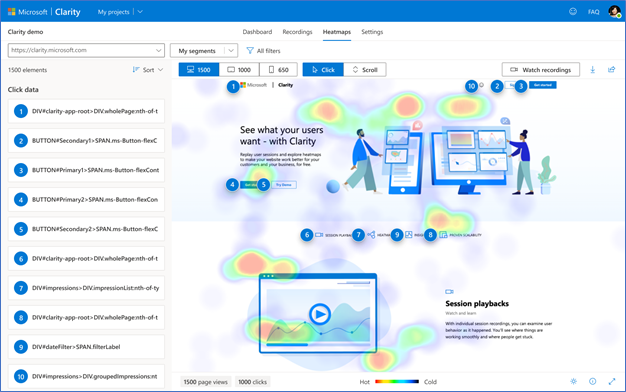
Clarity Heatmaps provides two types of heat map data:
1. Click Heat Maps
Click on heat maps:
- Show engagement levels for different parts of a web page.
- Detect where people clicked (including non-clickable page elements).
- and provide an idea of which page elements are important to most site visitors.
Click Heatmap data can be viewed for a single page or for a group of pages.
This data can be refined and segmented using filters to navigate and see how different users click on web page elements.
2. Go to Heatmaps
Scroll Heatmaps show how far users move on a web page. Like all of Clarity’s other features, filters can be applied to a Scroll Heatmap to see how different users scroll through a page – by device, for example.
Scroll Heatmap data is incredibly useful because it can show how far users scroll before they click a call to action.
Hover heatmaps can also help determine if users are not reaching a call to action or important information.
If users haven’t accessed certain content and are walking away from the site without converting, the heatmap data will show scrolling at the point where users bail on your site.
Actionable heatmap data
Clarity Heatmaps can be segmented by filters such as traffic sources, devices, and browsers to identify patterns displayed by different visitors.
Heatmap data is useful for debugging web pages by identifying where they click, better understanding user experience, and determining where users stay.
Additionally, they help improve conversions by showing where users are checking out or if calls to action have been passed in the past and not incentivizing clicks.
In my opinion, the most important quality of Clarity Heatmaps is to help improve conversions because most sites have a conversion action they want users to complete whether that’s clicking an ad, purchasing a product, clicking an affiliate link, or signing up for a newsletter.
Clarity Heatmap helps debug and improve conversion issues.
The information in Clarity Heatmaps may also be shared with others in your company and with customers.
Clarity Heatmap has no traffic restrictions, which makes it an attractive feature for publishers with high traffic and those just starting out.
Session recordings
Clear Session Recordings is a feature that records and displays a user’s journeys through a website. Shows how users interact with site navigation, calls to action, search features, and other elements on the page.
Session recordings show publishers whether site navigation and links help users find the content they want and can also show factors that aren’t working on a page, such as calls to action.
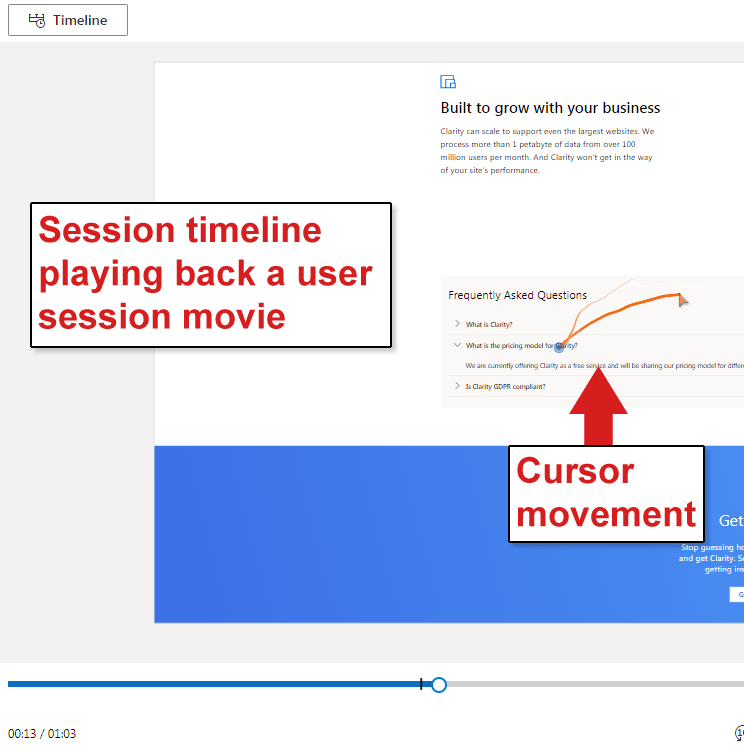 User session timeline screenshot, October 2020
Session recordings can identify angry clicks, dead clicks, fast backs, and excessive scrolling.
Fury clicks
Angry clicks indicate areas of a web page that may not be as interactive when the user expects them to be. A typical click jitter is characterized when a user repeatedly clicks on a web page element such as a link, button, or image.
For example, if the link isn’t working because the page isn’t fully loaded or the image looks like a link but isn’t one at all. Anger clicks are highlighted by Clarity to indicate areas of the user experience that indicate user frustration with a webpage.
dead clicks
A dead click is what happens when an interactive element does not respond in a reasonable amount of time or does not respond at all.
This is also an indication of user frustration.
Quick return
A quick return is when a user clicks away from your site to another site and then returns.
Microsoft indicates that this data point will be updated to include the original site so that it records when a user clicks from one page in a site to another page in the same site and then returns to the original page, indicating that they are not satisfied with the page they clicked on.
excessive scrolling
Session recordings can also detect what Microsoft calls “excessive scrolling.”
Excessive scrolling is when Clarity detects that a site visitor is scrolling up and down in an unusual pattern that indicates a poor user experience.
This data point may indicate that the user is not finding what they expect to find and potentially frustrate the site visitor in some other way, enough to cause them to leave the site.
Clarity session recordings provide valuable insights that can help increase sales, affiliate clicks, ad clicks, and site visitor satisfaction.
A useful feature of session recordings is that these data points can be segmented by browser, campaign, and 23 other filters.
Clarity session recordings are a powerful way to gain insights into user behavior and improve web page and website performance.
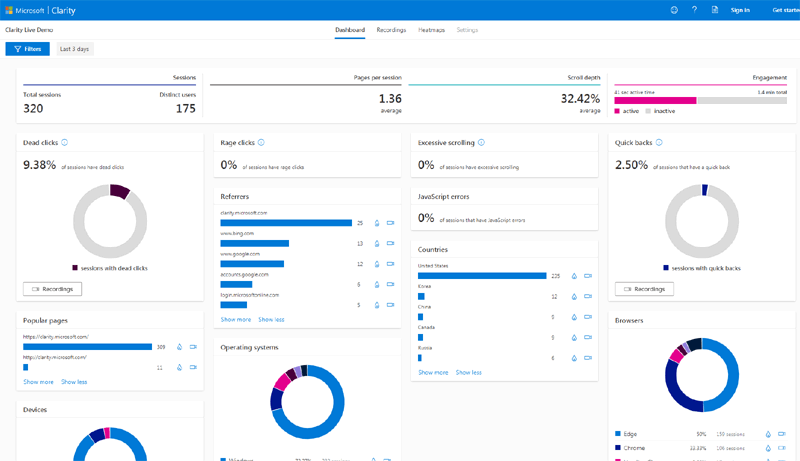
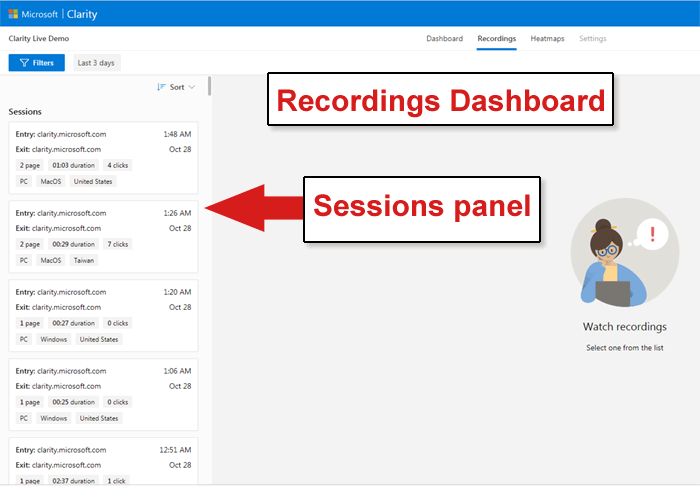 Screenshot from the scoreboard, October 2020
The session timeline, shown in the screenshot above, is like a movie of the user’s interaction with the page. Cursor movements appear.
The Session panel on the left allows the publisher to filter data to isolate a wide range of data types.
Individual sessions in the boxes can be selected and viewed.
In addition, one can click the Filters button at the top to select a large amount of data types, such as user device etc.
Clicking the Filters button brings up a web page full of filters.
To save space and provide a close-up, I cut the filters page in half, a left side and a right side.
 Screenshot of the left and right side of the filters, October 2020
Clarity Visions
Microsoft Clarity Insights is a feature that applies the power of deep artificial intelligence and machine learning algorithms to automatically display actionable insights from analytics data collected by Clarity.
 Screenshot from Insights Dashboard, October 2020
Clarity monitors session logs for JavaScript errors, jittery clicks, and dead clicks, as well as decides which browsers and user groups to watch.
Users can save groups for tracking.
Clarity Insights documentation says:
Clarity Insights is a set of machine learning (ML)-based filters and recommendations on what content should be most important to you.
… With a dashboard, you can understand your users without having to analyze the ocean of data drawn from user interactions on a website.
There is a central question: if Clarity can record every user interaction, how can it highlight the most important sessions and pages? One solution comes via the Clarity Insights platform.
Clarity Insights draws on Microsoft’s decades of experience in data science and machine learning to identify key trends and patterns in your site’s activity.
… Providing accurate, accessible, and proactive analytics is an essential feature of Clarity.”
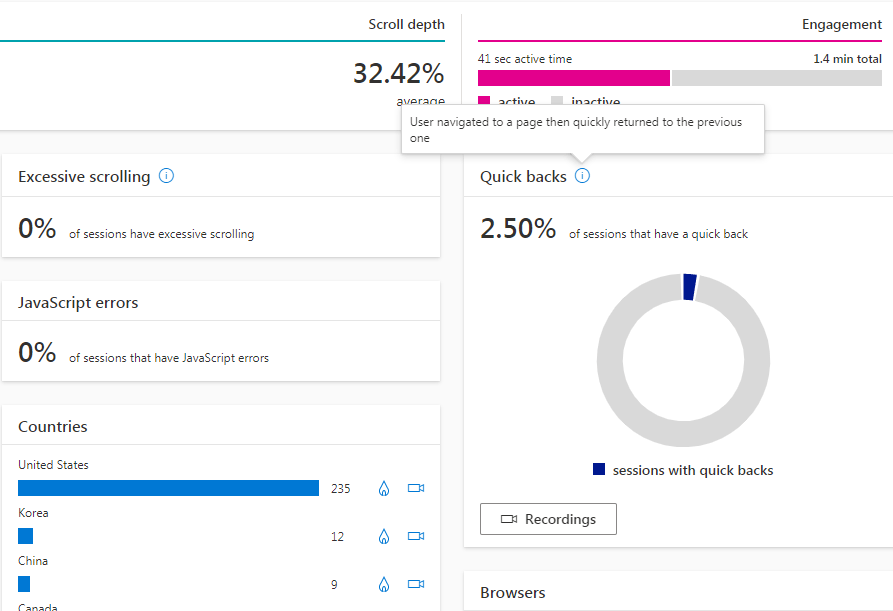 Screenshot of a close-up of the Microsoft Clarity “Insights” dashboard, October 2020
Add Microsoft Clarity Analytics to your Stack
The big question many ask is whether they should use Clarity given that they are already using another analytics software.
Clarity provides actionable insights to improve website revenue and user experience, something not many analytics software provide.
Microsoft Clarity is clearly not a competitor to Google Analytics, it is its complement.
Thus, it can be said that it is not appropriate to compare the two as they both solve different problems.
Clarity is a good product because it helps publishers improve conversions and sales, as well as the user experience of the site visitor.
What Clarity does is help publishers identify and improve the shortcomings of their site(s).
There is no pricing model for Microsoft Clarity – it’s free, no matter how much traffic the site attracts.
The only limitation on Clarity is that financial, government, and medical websites are not recommended by Microsoft for use in Clarity.
The answer to the question of whether you should use Microsoft Clarity, aside from the warning above, depends on how important it is to you to improve the earnings and user experience of your site visitors.
quotes:
- Read the The official Bing announcement is here.
- Registration page for Microsoft Clarity here.
More resources:
- The Bing Clarity Rage Clicks report helps improve user experience
- How to improve search engines using user experience factors
- How to do an SEO audit: The ultimate checklist
Featured image: Ollyy/Shutterstock